The use of three phase phase volt-ampere meter
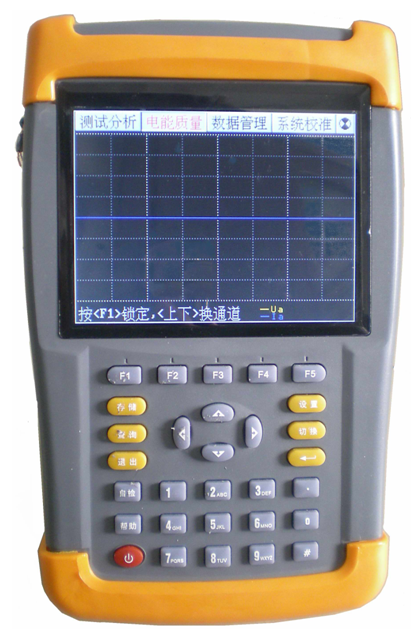
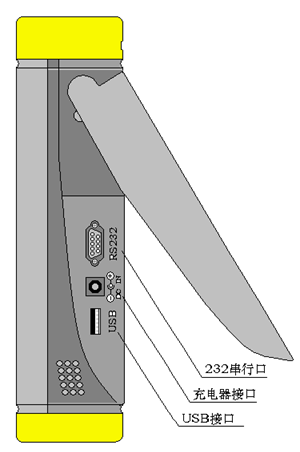
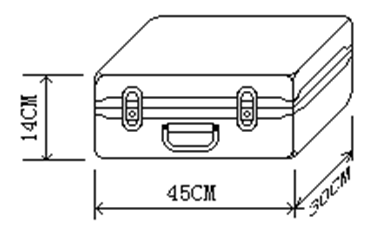
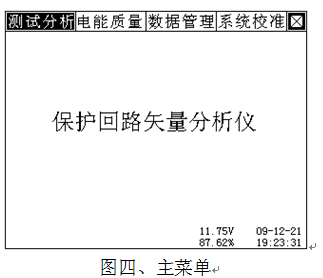
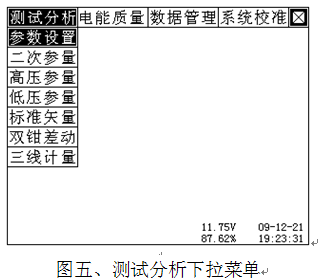
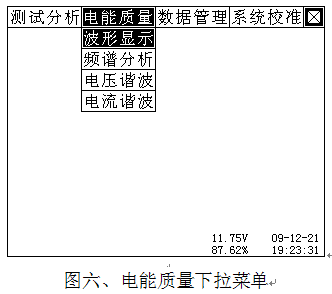
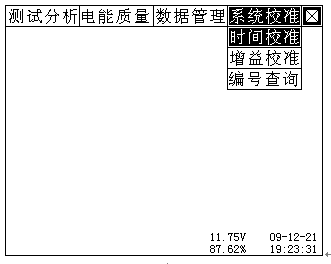
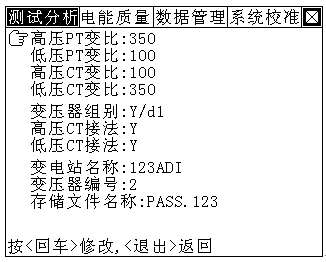
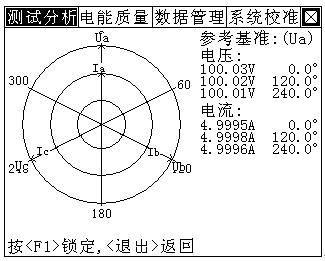
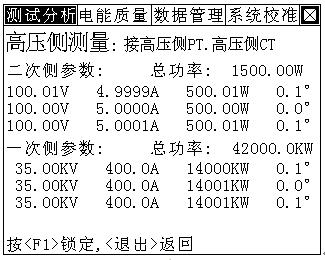
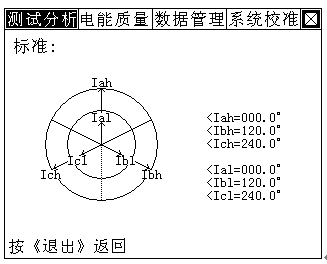
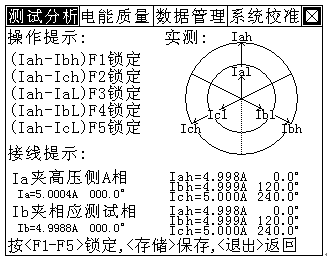
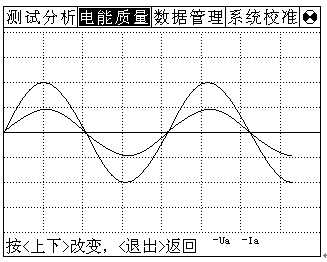
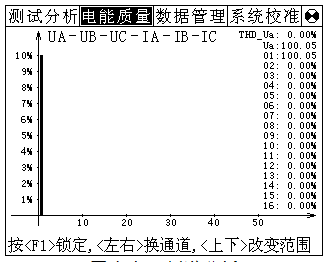
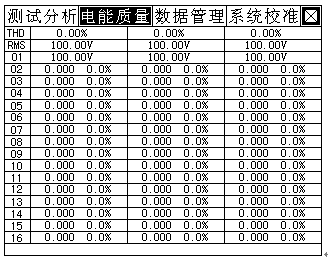
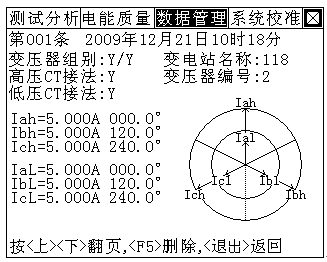
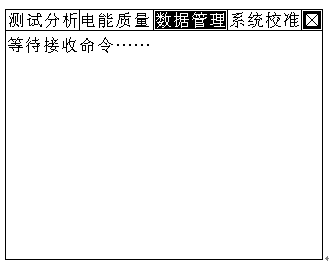
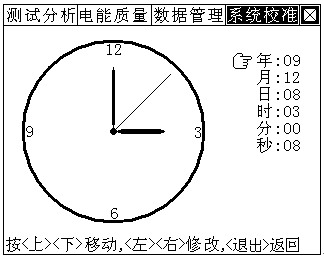
First, the main purpose The three voltage input channels are insulated and isolated from each other, and the three currents are input by a clamp-type current transformer , which is safe and reliable. Simultaneous measurement of alternating voltage path 1-3 without breaking the circuit under test, the amplitude and phase between an amount of 1-3 each passage of the alternating current, measuring the single / three phase power and power factor, frequency measurements, and The same screen is displayed as a vector diagram or a table. 1 ã€Set three-phase voltage, current, phase, phase sequence , frequency, active power , reactive power , power factor and other functions in one; can measure three-phase voltage, current, phase, power factor, active power, reactive power, Frequency isoelectric parameters. 2 , touch screen operation, Chinese character handwriting input; high-brightness true color fine display TFT screen, automatic backlight adjustment . 3 , there are vector diagrams, tables, sub-channels and other display methods, table mode display can display more than 20 parameters, measurement data at a glance, the color vector map is delicate and clear, the map can be displayed on each vector at the same time the amplitude and Angle and other information, vector graphics can be set to clockwise or counterclockwise positive direction, twelve o'clock or three o'clock direction is 0 degree angle direction, the reference angle angle is 330 degrees or 0 degrees , in line with various user habits And wiring. 4, all six input isolation support arbitrary wiring, not altogether three voltage channels, each voltage measurement may be performed between any two points can be measured between the primary and secondary voltage phase transformers, and then determine the polarity of transformer In phase measurement, any input can be used as a reference to measure the phase between any signals. 5 , support user software calibration. 6 , the measurement results can be added to the remarks, measurement data stored indefinitely. 7 , ultra-low power consumption, large-capacity lithium battery can work more than 10 hours, the standby time is longer, the number of charging ≥ 500 times , charging time is about 2.5 hours. The instrument can work properly with AC power during charging. First, LYXW9000 three-phase clamp phase phase volt-ampere meter features 1. Three-way voltage and three-way current vector are displayed on the same screen. For complex differential protection devices, multiple clamps can be used to make multiple measurements and a complete hexagon is drawn. 2. The use of clamp-type current transformer wiring, without disconnecting the current loop, is safe and convenient. 3. Vector analysis of complex protection devices can be performed to determine if the wiring is correct and give the correct wiring diagram for comparison. 4, can conduct regular electrical parameters test, while displaying the three-phase voltage, three-phase current, three-phase active power, three-phase apparent power, three-phase phase angle; and direct reading converted to the voltage amplitude of the primary side of the transformer, Current amplitude, power value. 5, can be three-phase three-wire high-voltage measurement device error wiring check, 48 kinds of three-phase three-wire wiring can be analyzed and judged directly to give analysis results; investigate and maliciously change metering means of electricity theft, effectively avoid the loss of electricity costs. 6, can carry on the harmonic analysis of the signal measured on the spot, can analyze the content of 2 - 50 times of each harmonic, automatically calculate the total harmonic distortion. 7, large-screen, high-brightness color LCD display, full-character graphical menus and operating tips to achieve a friendly man-machine dialogue, silicone touch keys to make the operation more comfortable, better feel, wide temperature LCD, with brightness adjustment, to adapt to the winter and summer Seasonal environment application. 8, large-capacity lithium battery power supply, continuous work up to 8 hours. 9. Users can save test data in the form of records at any time for centralized and unified management, filing and review, and can store over 2000 sets of data. 10. The saved records can be uploaded to the back office management computer for comprehensive analysis and review. 11, with the calendar, clock function, real-time display of the test work carried out on the date and time. 12, small size, light weight, easy to use on the scene. 13, reserved USB interface, available instruments can replace USB and other removable storage devices. Second, LYXW9000 three-phase clamp phase volt-ampere meter technical indicators Input characteristics Voltage channel number: 3 channels Voltage measurement range: 0~450V Voltage display digits: 6 digits Current channel number: 3 channels Current measurement range: 0~10A Current display digits: 6 digits Phase measurement range: - 180 ° ~ + 180 ° Number of harmonic analysis: 2 to 50 times Accuracy Voltage: ± 0.2% Current, power: ± 0.5% Phase angle: ± 2 ° Harmonic voltage content measurement error: ≤ 0.3 % Harmonic current content rate measurement error: ≤ 0.5 % Working temperature: - 15 °C ~ + 40 °C Charging power supply: AC 160V~260V Insulation: â‘´, voltage, current input terminal housing insulation resistance ≥ 100M?. (2) The input end of the working power source withstands the power frequency 2KV (effective value) between the housings and lasts for 1 minute. Volume: 250mm × 160mm × 60mm Weight: 1.8Kg Three, LYXW9000 three-phase clamp phase phase volt-ampere meter structure appearance (a), external dimensions and panel layout The instrument looks squarely as shown in Figure 1: Figure I. Instrument front view Above the front of the instrument is a liquid crystal display, the bottom is the button area, the top is the wiring part, including: four voltage input terminals UA , UB , UC , UN ; three current input interfaces ( phase A current clamp interface Ia , B phase current clamp Interface Ib , C phase current clamp interface Ic ). The external interface of the instrument is on the right side (see Figure 2). When the rear bracket is opened, the interface part can be exposed, including the following three parts: 232 serial port (used to upload saved data to the computer); can also be used to update the program; Note: This interface and the computer must be connected with a dedicated communications cable, ordinary serial line is not suitable for the use of this interface. The charger interface is used to connect the charger. When the power of the instrument is insufficient, the charger is connected to this interface to charge the instrument. The USB interface can be connected to the computer through a dedicated data cable, and the memory card in the instrument can be used as a large-capacity memory. The side view is shown in Figure 2 on the right. Figure 2. Right view of the instrument The outer dimensions of the outer box of the instrument are shown in Figure 3: Figure 3, outside the box (B), keyboard operation The keyboard has a total of 30 keys, namely: switch, store, query, set, switch, ↑, ↓, â†, →, à , exit, self-test, help, number 1 , number 2 ( ABC ), number 3 ( DEF ) , number 4 ( GHI ), number 5 ( JKL ), number 6 ( MNO ), number 7 ( PQRS ), number 8 ( TUV ), number 9 ( WXYZ ), number 0 , decimal point, #, auxiliary functions built F1 , F2 , F3 , F4 , F5 . The key functions are as follows: Switch key: It is used to control the power on and off of the instrument. Use: Hold down this key for more than 2 seconds, then release it. ↑, ↓, â†, → keys: Cursor movement keys; used in the main menu to move the cursor to point to a function menu, press the confirmation key to enter the corresponding function; in the parameter setting function screen state, the up and down keys Used to switch the current options, left and right keys to change the value. In addition, ↓ can also be used to display subdirectory menus. Ø key: confirm key; in the main menu, press this key to display the menu subdirectory. In the subdirectory, press this key to enter the selected function. In addition, when you enter certain parameters, this key determines the start input and End the input. Exit key: Back key, press this key to return to the main menu directly. Storage key: Applied under the interface of differential analysis function to store the test result in the form of record. Query key: Used to browse stored records. Set key: keep function, not used temporarily. Switch key: keep function, temporarily not use. Self-test key: used to burn fonts during instrument debugging. This function does not require users to use it. Help key: Used to display help information. Numeric (character) key: Input for parameter setting (numeric or character can be input). Decimal point key: Used to enter a decimal point when setting parameters. # key: reserved function, temporarily not used. F1 , F2 , F3 , F4 , F5 keys: auxiliary function keys (shortcut keys). Used to quickly enter the auxiliary function interface or implement the corresponding function of prompt information prompt. Fourth, the liquid crystal interface The liquid crystal display interface mainly has twenty screens, including a main menu, four pull-down menus, and seventeen function interfaces: 1 . main menu: When the power is turned on, the interface in Figure 4 is displayed. The top line of the screen is displayed as various function menus, including four options: test analysis, power quality, data management, and system calibration. Select â†, → keys to change the current options; select ↓ key or confirm key to display the corresponding pull-down menu, press the OK key to enter the corresponding function test and settings; the lower right corner of the screen shows the built-in rechargeable battery voltage amplitude and remaining power Percentage, the user can use this value to determine whether the instrument needs to be charged; the far right displays the current real-time date and time. 2 . Test Analysis drop-down menu: The test analysis drop-down menu is shown in Figure 5, among which there are seven functional options, namely: parameter setting, secondary parameters, high-pressure parameters, low-pressure parameters, six-clamp differential, double-clamp differential, and three-wire measurement; You can change the currently selected item. Press the OK key to enter the corresponding function test and settings, press the Exit key to return to the main menu. 3 . Power quality drop-down menu: The test analysis drop-down menu is shown in Figure 6. There are four function options: waveform display, spectrum analysis, voltage harmonics, and current harmonics; press ↑↓ to change the currently selected item. Press the OK key to enter the corresponding function test and settings, press the Exit key to return to the main menu. 4 . Data Management drop-down menu: Figure 7, data management drop-down menu The data management pull-down menu is shown in Figure 7. There are three function options: record query, online communication, and help file; press ↑↓ key to change the currently selected item. Press the OK key to enter the corresponding function test and settings, press the Exit key to return to the main menu. 5 . System calibration drop-down menu: Figure 8, system calibration drop-down menu The system calibration drop-down menu is shown in Figure 8. There are three function options: time calibration, gain calibration, and number query; press ↑↓ to change the currently selected item. Press the OK key to enter the corresponding function test and settings, press the Exit key to return to the main menu. 6 . Test Analysis - Parameter Settings Interface Figure IX, parameter settings The parameter setting interface is shown in Figure 9. This screen is used to adjust the data to be determined before the test. Including: high-voltage PT transformation ratio, low-pressure PT transformation ratio, high-pressure CT ratio, low-voltage CT ratio, transformer group, high-voltage CT connection, low-voltage CT connection, substation name, transformer number, storage file name. High-voltage PT transformation ratio: refers to the transformer ratio of the high-voltage side of the transformer under test. The input method is: Press the confirmation key to make the number red, then press the corresponding number key to input data, and then press the confirmation key to finish. Low-voltage PT transformation ratio: refers to the ratio of the voltage transformer of the low-voltage side of the transformer under test. The input method is: Press the confirmation key to make the number red, then press the corresponding number key to input data, and then press the confirmation key to finish. High-voltage CT transformation ratio: refers to the ratio of the transformer's low-voltage side current transformer ratio. The input method is: Press the confirmation key to make the number red, then press the corresponding number key to input data, and then press the confirmation key to finish. Low-voltage CT transformation ratio: refers to the transformer ratio of the transformer's low-voltage side current transformer. The input method is: Press the confirmation key to make the number red, then press the corresponding number key to input data, and then press the confirmation key to finish. Transformer group: refers to the connected group of transformers under test. Including methods: Y/Y , Y/D1 , Y/D5 , Y/D11 and so on. Use the ↠and → keys to switch between several modes and select the desired mode. This parameter must be set correctly when performing differential wiring analysis; otherwise, the standard vector diagram will be incorrect. High-voltage CT connection method: refers to the connection method of the current transformer of the transformer high-voltage side. There are Y and â–³ two ways. Use the ↠and → keys to switch between several modes and select the desired mode. Low-voltage CT connection method: refers to the connection method of the current transformer on the low-voltage side of the transformer under test. There are Y and â–³ two ways. Use the ↠and → keys to switch between several modes and select the desired mode. Substation name: The substation name where the test site is located, used to distinguish the saved results. Consists of numbers and letters and can be combined in any combination. Enter directly via the corresponding number / letter key. Transformer number: It refers to the number of the tested transformer. Used with the Substation Name Item to distinguish the saved results. Consists of numbers and letters and can be combined in any combination. Enter directly via the corresponding number / letter key. Store File Name: Record the stored file name. Does not work temporarily. 7 . Test Analysis - Quadratic Parameter Interface Figure 10, quadratic parameters The quadratic parameter interface is shown in Fig. 10. The left side of the interface shows the real-time vector diagram of three-phase voltage signals and three-phase currents. The right side shows the voltage and current amplitudes and the phase angle relative to the reference reference signal. The reference reference is automatically selected. When Ua has a signal ( Ua>10V ), Ua is the reference, and the phase angles of other parameters are the angles with Ua . When Ua has no signal ( Ua<10V ), Ia is preferred as the reference. With reference to the reference, the phase angles of other parameters are the angles with Ia ; when Ua and Ia have no signal ( Ua<10V , Ia<5mA ), only the amplitude will be displayed, and all the phase angles are not displayed. In this screen, press the F1 key to lock the screen (do not refresh), and then press the F2 key to unlock the data and start refreshing. The next line at the bottom of the screen prompts for possible actions. 8 . Test Analysis - High Pressure Parameter Interface Figure XI. High-pressure parameters The high-voltage parameter interface is shown in Figure 11. The first line of this interface shows the precautions for wiring (the voltage line is connected to the PT outlet of the high-voltage side of the test object, and the current line is connected to the CT output of the high-voltage side of the sample ); The measured data of the transformer high-voltage side to be measured include: three-phase voltage, three-phase current, three-phase power, three-phase phase angle, and total power; at the same time, it shows that the transformer ratio and current transformer change according to the input high-voltage side voltage transformer. Transformer's primary data converted from the ratio: including primary three-phase voltage (secondary voltage amplitude multiplied by high-side PT transformation ratio) and primary three-phase current (secondary current amplitude multiplied by high-side CT ratio) First, three-phase power (multiple of secondary power multiplied by the product of PT and CT ratio of high-voltage side ), primary three-phase phase angle, and total primary power; through this interface, one can directly observe the primary and secondary voltages of the high-voltage side of the test object. Current, power, and power data are used to monitor and analyze the load. In this screen, press the F1 key to lock the screen (do not refresh), and then press the F2 key to unlock the data and start refreshing. The next line at the bottom of the screen prompts for possible actions. 9 . Test Analysis - Low Pressure Parameter Interface Figure 12. Low pressure parameters The low-pressure parameter interface is shown in Figure 12. The first line of this interface shows the precautions for wiring (the voltage line is connected to the PT outlet of the low-voltage side of the tested product , and the current line is connected to the CT outlet of the low-voltage side of the sample ); The measured data of the measured low-voltage side of the transformer include: three-phase voltage, three-phase current, three-phase power, three-phase phase angle, and total power; at the same time, the input voltage ratio of the low-voltage side transformer and the current transformer change are also displayed. The value-converted transformer primary data includes a primary three-phase voltage (secondary voltage amplitude multiplied by the low-voltage side PT transformation ratio) and a primary three-phase current (secondary current amplitude multiplied by the low-pressure side CT transformation ratio). First, three-phase power (second power multiplied by the product of PT , CT ratio of low-voltage side ), a three-phase phase angle, a total power; Through this interface, you can visually observe the primary and secondary voltage of the low-voltage side of the test product. Current, power, and power data are used to monitor and analyze the load. In this screen, press the F1 key to lock the screen (do not refresh), and then press the F2 key to unlock the data and start refreshing. The next line at the bottom of the screen prompts for possible actions. 10 . Test Analysis - Standard Vector Interface The standard vector interface is shown in Figure 13: Figure 13. Standard Vector The figure shows: the left side is the standard vector diagram; the right side of the screen is the phase angles of the phase currents of the high- and low-voltage side phases in the standard wiring (all the phase angles are the test results with Iah as the reference). The next line at the bottom of the screen prompts for possible actions. 11 . Test Analysis - Dual Forceps Differential Interface Figure 14: Double clamp differential The double clamp differential interface is shown in Figure 14. This interface is the use of double clamp method for differential protection device wiring analysis, using two clamp current meter to measure the phase of the measured protection device current in turn, and then draw a single parameter vector map, when all the tests are completed, The test is over. The left side of the figure is the test prompt: Use the auxiliary function keys F1 - F5 to lock the Ibh , Ich , IaL , IbL , IcL several kinds of parameters, draw the corresponding vector, the right side is the actual drawn vector. The lower side of the vector diagram corresponds to each parameter. Press <memory> key saves the results after the test. 12 . Test Analysis - Three-Wire Metering Interface Figure XV, three-line measurement The three-wire analysis interface is shown in Figure 15. This interface is used to analyze the wiring of the three-phase three-line high voltage metering device. The figure shows: the left side is the display of three-phase three-wire vector, and the four parameters of three-phase and three-wire are displayed in the form of vector diagram ( Uab , Ucb , The phase relationship between Ia and Ic can also be used to decompose the phase voltages Ua , Ub , Uc according to the relationship of two voltage parameters (the three quantities are virtual and do not actually exist); all parameters are referenced to Uab . For benchmarking, we set the initial phase angle of Uab to 330 °, and the phase angles of other parameters are based on this to calculate the corresponding phase angle. The right side shows the phase angle between each parameter and the reference reference; the lower side is the wiring determination result, including 48 kinds of wiring modes (in the analysis results: the first line of voltage determination results, the positive sequence represents the voltage phase sequence is positive, otherwise The negative sequence will be displayed; Uab Ucb indicates that the two voltages are Uab and Ucb respectively ; the second line of the analysis result is the current determination result, the positive sequence represents the current phase, and the + Ia + Ic represents the polarity of the AC two-phase current. Don't be correct.) , can analyze and give the judgment result. The prompt line of the next line of the display screen is visible in the figure. The prompt line prompts the operator to press the ↑↓ button to change the range of power angle ( normally, the power angle range is -5 ° to 55 °, which indicates the power The normal power angle range of the system is inductive load. When the inductive load exceeds the permissible range, capacitance compensation is used to make it smaller, so as to reduce the generation of reactive power. When over-compensation, it will cause capacitive load. At this time, it should be selected. The power angle range is - 65 ° to - 5 ° ) to accurately determine the type of wiring error. In this screen, press the F1 key to lock the screen (do not refresh), and then press the F2 key to unlock the data and start refreshing. The next line at the bottom of the screen prompts for possible actions. 13 . Power Quality - Waveform Display Interface Figure 16. Waveform display In this screen, the current actual waveforms of each measured analog quantity can be displayed. The waveform can be refreshed in real time, and the distortion of the signal under test can be visually displayed (whether or not it is distorted and whether it is truncated). The waveforms currently displayed are Ua and Ia . ↑ ↓ keys with different phases respectively to switch; can be switched to the B-phase voltage, current waveforms, C phase voltage, current, a, B, C all three phases of voltage and current waveforms. Can be used as a simple oscilloscope. The next line at the bottom of the screen prompts for possible actions. 14 . Power Quality - Spectrum Analysis Interface Figure 17. Spectrum Analysis The spectrum analysis interface is shown in Figure 17. This screen shows the A- phase voltage, B- phase voltage, C- phase voltage, A- phase current (tested with Ia ), B- phase current (tested with Ib ), and C- phase current (tested with Ic ) in the form of a histogram. Harmonic content distribution histogram. The UA-UB-UC-IA-IB-IC prompts the current measurement channel (the ↠and → keys can be used to change the selected channel). The ordinate scale of 0%-10% indicates the percentage content of each harmonic component. The fundamental wave content Always correspond to 100 % scale (When all the harmonic content is less than 10% , zoom display, ie, 10% as full scale; When there is more than one harmonic content is greater than 10% , display with normal scale, That is, 100% is used as a full scale. 0-30 on the abscissa indicates the number of harmonics, and the right-hand value indicates THD , rms, and 32th harmonics. The distortion-free signal should show the first harmonic (fundamental wave). With Ua, Ub, Uc three voltage channels and Ia, Ib, Ic three test current path is measured. The next line at the bottom of the screen prompts for possible actions. 15 . Power Quality - Voltage Harmonic Interface Figure 18, voltage harmonics This screen shows the harmonic content of each phase voltage signal (from left to right, A , B , and C phase voltages), where THD is the voltage waveform distortion rate of each phase (that is, total harmonic distortion), RMS For each phase voltage rms value, 01th is the fundamental voltage (indicated by the actual amplitude), followed by the values ​​of other harmonics in order, expressed in terms of the effective value form and the percentage of the fundamental wave, in the form of The form displays 1-64 voltage harmonics. The 低 key can be used to switch the low 16 times ( 01 - 16 ) and the low 16 times ( 17 - 32 ), the middle high 16 times ( 33-48 ), and the high 16 times ( 49-64 ) harmonic content. 16 . Power Quality-Current Harmonic Interface Figure 19. Current harmonics This screen shows the harmonic content of each phase current signal (from left to right, A , B , C phase currents), where THD is the current waveform distortion rate of each phase (that is, total harmonic distortion), RMS For each phase of the current rms value, 01th is the fundamental current (expressed by the actual amplitude), followed by the values ​​of the other harmonics, expressed in terms of the effective value and the percentage of the fundamental wave, in the form of The form displays 1-64 current harmonics. You can use the ↑↓ key to switch between Low 16 ( 01-16 ) and Medium Low 16 ( 17-32 ), Medium High 16 ( 33-48 ), and High 16 ( 49-64 ) harmonic levels. 17 . Data Management - Record Query Interface Figure 20, record query The record query screen is shown in Figure 20. This screen can consult the saved differential analysis test record. The next line at the bottom of the screen prompts for possible actions. 18 . Data Management - Online Communication Interface Figure 21, online communication The connection communication interface is shown in Figure 21. This function screen can upload test records saved in the instrument memory to the back-end management computer. 19 . Data Management - Help File Interface Figure 22. Help file The help file interface is shown in Figure 22. This function screen is used to help the instrument. This information can be updated at any time. 20 . System Calibration - Time Calibration Interface Figure 23, time calibration The time alignment interface is shown in Figure 23. This function screen is used to adjust the date and time of the current internal clock of the instrument. The next line at the bottom of the screen prompts for possible actions. 21 . System Calibration - Gain Calibration Interface This interface is used to adjust the accuracy of the instrument before it leaves the market. No instructions are provided here. 22 . System Calibration - Numbering Query Interface Figure 24, numbering The numbering interface is shown in Figure 24. This interface is used to query the serial number of the instrument. You must know the serial number of the instrument when you upgrade the program. Otherwise, the
Brief
Introduction:
Sand Dryer
is designed for sand drying as a Drum Dryer. Through a variety of different
properties of sand, the sand dryer to optimized the design for a wide range of
low moisture content. The drying result is excellent. Our Sand Drying Machine is widely
used in sand and building sand drying, especially successfully applied to the
dry mortar, construction, new materials and other industries.
Features:
1. The
roller of Rotary Dryer machine is made of light plate's stainless steel which
has excellent heat resistance, the inner-wall smooth, can reduce the materials'
wear and tear.
2. Efficient
radiator, and with a reasonable lead air duct, so that the hot air can direct
contact with materials, greatly improving the drying efficiency, while saving
energy.
3. Using
computer control, we can set different rotary drying temperature and rotary
drum drying time according to the drying requirements.
Technical Parameters:
Sand Dryer Sand Dryer,Sea Sand Dryer,Silica Sand Dryer,Quartz Sand Dryer,Sand Drying Machine Zhengzhou Zhongding Heavy Duty Machine Manufacturing Co.,Ltd. , https://www.zonedingmac.com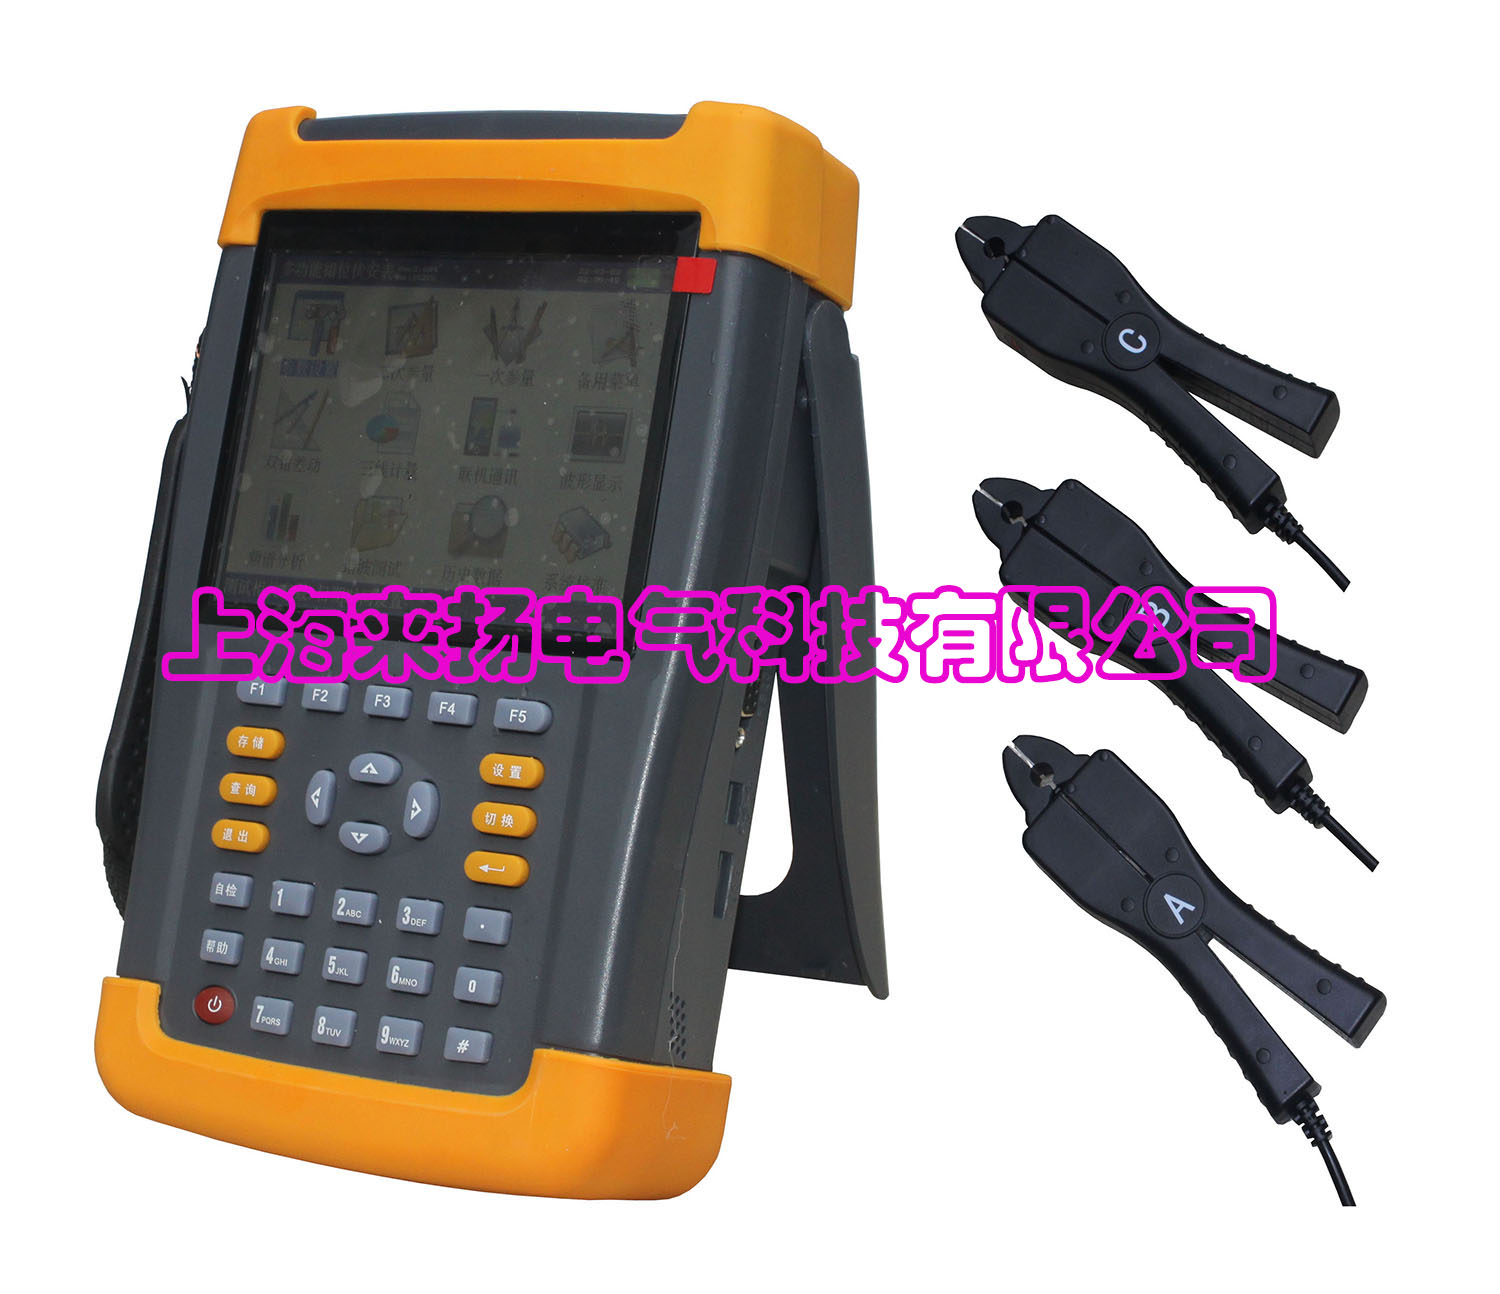
 Â Â


Model
Shell diameter (mm)
Shell length (mm)
Slope(°)
Rotary speed(r/m)
Weight(t)
Power (KW)
Volume (m3)
Φ0.6×8
600
8000
3-5
8
5.1
5.5
2.26
Φ0.8×10
800
10000
3-5
7.2
6.9
5.5
5.02
Φ1.0×10
1000
10000
3-5
6.73
7.5
7.5
7.85
Φ1.2×12
1200
12000
3-5
5.8
13.1
11
13.3
Φ1.5×12
1500
12000
3-5
5.4
19
18.5
21.2
Φ1.8×12
1800
12000
3-5
5
25
18.5
30.52
Φ2.2×16
2200
16000
3-5
3.2
41
30
60.8
Φ2.4×18
2400
18000
3-5
3
51
30
81.43
Φ2.8×24
2800
24000
3-5
2-5
97
75
147.8
Φ3.0×26
3000
26000
3-5
2-5
110
90
183.7